Status. This is a patch under review, not a feature in any release. Commitfest entry: 7566. Discussion: pgsql-hackers thread. If you run Postgres on Windows, or you’re interested in the code, reviews are welcome there.
Say a checkpoint on a Windows server takes longer than it should. What can you actually look at?
You can look at pg_stat_checkpointer and the server log, which tell you the
checkpoint was slow and roughly how long each phase took. You can look at wait
events, which tell you what a backend is waiting on right now. You can record a
Windows Performance Recorder trace with CPU sampling, and if you have symbols
it will show you BufferSync and ProcessSyncRequests on the same timeline as
the disk. That last one is the closest you get, and you’re still guessing where
one phase ended and the next began from which functions happened to be on the
stack when the sampler fired.
What you want is for Postgres to say “the write phase starts now, here’s each buffer I wrote, the sync phase starts now”, in the same trace as the kernel’s disk events, on the same clock. How do you get that on Windows?
The probes already exist
The frustrating part is that Postgres already has exactly this instrumentation. There are fifty-seven static trace probes covering transactions, query processing, the buffer and storage managers, locks, WAL, checkpoints and sorts. On Linux you attach to them with bpftrace, perf or SystemTap, and on macOS and the BSDs with DTrace.
Windows has its own tracing facility, Event Tracing for Windows, which the kernel and most of the OS already report through. Postgres just never had a backend for it, so a Windows build falls back to a generated dummy header in which every probe expands to this:
#define TRACE_POSTGRESQL_BUFFER_READ_START(...) do {} while (0)
That’s the right thing for a build with no tracer: the call sites still compile, and the compiler throws the empty loop away. The trouble is that Windows builds have never had anything else. The probes went in for 8.2 and the generated dummy header for 8.4, and in all that time there’s been no way to trace them on Windows.
Why nobody wired them up
I assumed someone had tried this and been talked out of it, so I went through the mailing list archives and the commitfest history looking for the thread. I couldn’t find one.
The obvious candidate, DTrace for Windows, doesn’t help. It’s a kernel driver
you turn on with bcdedit and a reboot, and the providers Microsoft lists
include syscall, fbt, pid and etw. Postgres’s probes are USDT probes, and
there’s no USDT provider, so installing it does nothing for them. It does have
that etw provider, though, which turns out to matter: once the probes are ETW
events, DTrace scripts can read them like anything else.
The other obstacle was ETW itself. The classic API wanted an event manifest,
compiled with mc.exe and registered with the OS at install time. That’s a lot
of machinery for a project that people install several major versions of side
by side. TraceLogging, the manifest-free API, came with the Windows 10 SDK, and
the standard tools only decode its events on Windows 10 and Server 2016 or
later. For most of the probes’ life that wasn’t something Postgres could rely
on. Postgres requires Windows 10 now, so it can.
Turning the probes into ETW events
The patch adds an ETW backend, which Windows builds use in place of the dummy
header, the way macOS uses DTrace and Linux uses SystemTap. The probe set and
the call sites don’t change, and probes.d stays the single
source of truth for argument types. What changes is the macro. The -Detw
build option defaults to auto, so a Visual Studio build picks it up without
being asked, and the buffer read probe becomes a real event:
#define TRACE_POSTGRESQL_BUFFER_READ_START(arg1, arg2, ...) \
    TraceLoggingWrite(pg_etw_provider, "buffer_read_start", \
        TraceLoggingKeyword(PG_KW_BUFFER), \
        TraceLoggingLevel(WINEVENT_LEVEL_VERBOSE), \
        TraceLoggingInt32((arg1), "forknum"), \
        TraceLoggingUInt32((arg2), "blocknum"), ...)
TraceLogging events carry their own schema, so there’s nothing to register and
no decoder to ship. You record them with wpr, xperf or logman and read
them in WPA, PerfView or tracerpt, with every field shown by name. wpr,
logman and tracerpt come with Windows. WPA and xperf are in the free
Windows Performance Toolkit, and PerfView is a free download from Microsoft.
Everything goes to one provider, PostgreSQL.Server. Its GUID,
ea7811de-e757-5488-7ad6-2b057cced37d, is the standard ETW hash of that name,
which is what Microsoft recommends for TraceLogging providers. As long as the
name stays put, so does the GUID, and saved capture profiles keep working from
release to release. Tools that can hash a name themselves, like PerfView with
*PostgreSQL.Server, don’t need the hex at all.
The field names come from a separate file, probes_etw.txt, next to
probes.d. They’re lifted from the argument descriptions already in the docs,
and each one is listed with its type. The generator cross-checks the two files
and fails the build if a probe is missing from either one, or if an argument’s
type differs between them or has no mapping. Builds on other platforms run the
same check, so someone adding a probe on Linux finds out right away instead of
breaking the Windows build later. That check paid for itself while
I was rebasing. Upstream retyped the byte counts in two storage-manager probes
(they ended up as ssize_t and size_t), and instead of quietly writing wrong values into
traces, the build stopped and named the probe and the type. String arguments
like query text are clipped to 32 kB, because ETW drops an event that’s too
big instead of truncating it.
Each event also gets a keyword and a level, so you can record one subsystem and skip the rest. A session picks keywords with a bitmask, so to record more than one you OR their bits together:
| Keyword | Bit | Probes |
|---|---|---|
| query | 0x01 | Parse, rewrite, plan, execute, statement status |
| transaction | 0x02 | Transaction start, commit, abort |
| lock | 0x04 | Lightweight locks, heavyweight lock waits, deadlocks |
| buffer | 0x08 | Buffer reads, flushes, extends, checkpoint buffer writes |
| storage | 0x10 | Storage manager block reads and writes |
| WAL | 0x20 | WAL insert, segment switch, buffer writes |
| checkpoint | 0x40 | Checkpoint phases, including CLOG, SUBTRANS, MultiXact and two-phase |
| sort | 0x80 | Sort start and done |
There are two levels. Transactions, queries, checkpoints and heavyweight lock
waits are low-rate and sit at INFO. Lightweight locks, buffer and block I/O, sorts and WAL inserts fire
constantly, so they sit at VERBOSE and stay out of your trace unless you ask
for them.
Reading a checkpoint
Here’s the payoff. ETW is also how the Windows kernel reports disk I/O, context
switches and scheduling, so if you record the PostgreSQL.Server provider and
the kernel in the same session, they share one clock. Linux has had this for a
while, since bpftrace and perf can record the probes and the block I/O
tracepoints together. Now Postgres on Windows can do the same.
This is a checkpoint, with the Postgres events on top and disk utilization
underneath. The solid bands are buffer_sync_written and the
buffer_flush_start and buffer_flush_done pair around each write, one of
each per buffer the checkpointer wrote. There are 38,242 of each, packed so
tightly the markers merge.
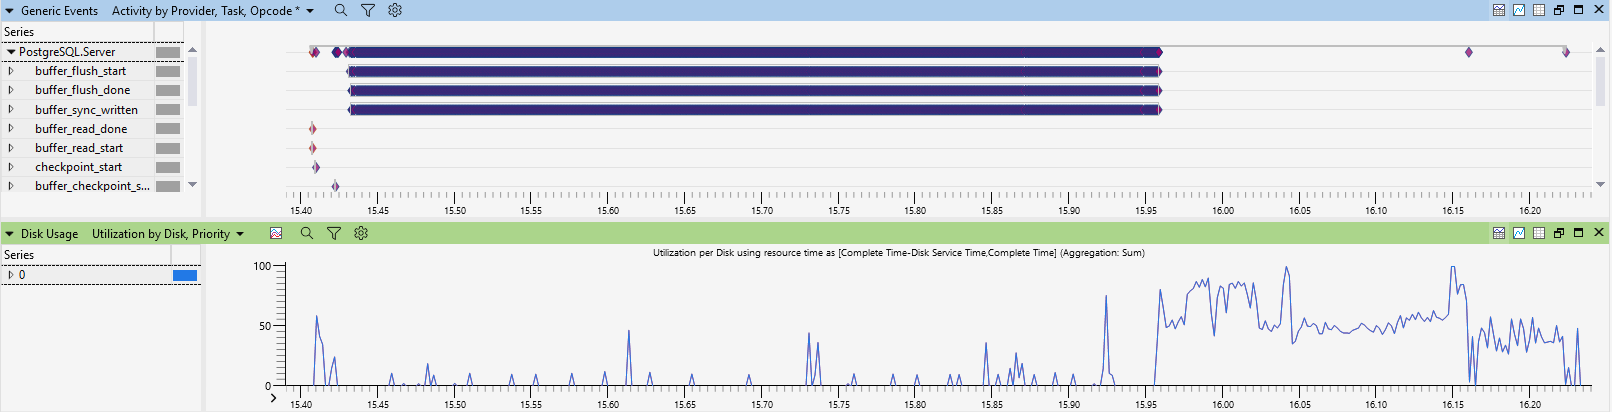
The disk barely moves while those writes happen. A few short spikes, nothing
sustained. The checkpointer spends about 530 ms on the write phase, but the
writes are landing in the OS cache, so that time goes to copying pages, not
waiting on storage. The disk gets busy at 15.96, the moment
buffer_checkpoint_sync_start fires and the checkpointer starts calling fsync,
and stays busy for the quarter of a second until checkpoint_done. Nearly all
of this checkpoint’s I/O happened in the sync phase.
That’s only true because the write phase was short. Windows starts writing cached pages out in the background after about a second, so a longer write phase would show disk activity before the sync starts.
This is the kind of question the combined trace answers directly. If the disk is pinned through the sync phase, storage is your bottleneck. If a checkpoint is slow and the disk is mostly idle, the time is going somewhere else, and you can stop looking at storage. With sampled stacks alone you’d be working out the phase boundaries by hand.
Try it yourself
You’ll need Visual Studio (the backend needs the Windows SDK, so MinGW builds
don’t get it), the Windows Performance Toolkit (wpr, wpa, xperf, from the
Windows ADK), and an elevated prompt, because the kernel side of the capture
needs it.
Download the patches from the commitfest entry, apply them to a current master checkout, and build from a Visual Studio developer prompt:
git am v1-*.patch
meson setup build --prefix=C:\pg -Detw=enabled
ninja -C build install
Then put C:\pg\bin on your PATH and start a scratch cluster:
initdb -D C:\pgdata
pg_ctl -D C:\pgdata -l C:\pgdata\log.txt start
Default settings are fine. The checkpoint in the screenshot came from a
server with shared_buffers = 1GB and timed checkpoints pushed out to an
hour, so it wrote more buffers than yours will, but the shape is the same. I
checked: with default settings the same steps give a checkpoint of about
15,000 buffers that looks just like it.
Save this as postgresql.wprp. It records the kernel’s disk and CPU activity
plus the PostgreSQL.Server provider, limited to the buffer and checkpoint
keywords (0x08 | 0x40 = 0x48) so the capture stays small:
<?xml version="1.0" encoding="utf-8"?>
<WindowsPerformanceRecorder Version="1.0" Author="PostgreSQL">
  <Profiles>
    <SystemCollector Id="SC_PG" Name="NT Kernel Logger">
      <BufferSize Value="1024" /><Buffers Value="256" />
    </SystemCollector>
    <EventCollector Id="EC_PG" Name="PostgreSQL Collector">
      <BufferSize Value="1024" /><Buffers Value="256" />
    </EventCollector>
    <SystemProvider Id="SP_PG">
      <Keywords>
        <Keyword Value="ProcessThread" /><Keyword Value="Loader" />
        <Keyword Value="DiskIO" /><Keyword Value="CSwitch" />
      </Keywords>
    </SystemProvider>
    <EventProvider Id="EP_PG" Name="ea7811de-e757-5488-7ad6-2b057cced37d" Level="5">
      <Keywords><Keyword Value="0x0000000000000048" /></Keywords>
    </EventProvider>
    <Profile Id="PostgreSQL.Verbose.File" Name="PostgreSQL"
             Description="PostgreSQL probes with kernel disk activity"
             LoggingMode="File" DetailLevel="Verbose">
      <Collectors>
        <SystemCollectorId Value="SC_PG"><SystemProviderId Value="SP_PG" /></SystemCollectorId>
        <EventCollectorId Value="EC_PG">
          <EventProviders><EventProviderId Value="EP_PG" /></EventProviders>
        </EventCollectorId>
      </Collectors>
    </Profile>
    <Profile Id="PostgreSQL.Verbose.Memory" Name="PostgreSQL"
             Description="PostgreSQL probes with kernel disk activity"
             LoggingMode="Memory" DetailLevel="Verbose" Base="PostgreSQL.Verbose.File" />
  </Profiles>
</WindowsPerformanceRecorder>
Initialize a pgbench database, record a short write load, and force a checkpoint at the end so there’s one to look at:
pgbench -i -s 20 postgres
wpr -start postgresql.wprp -filemode
pgbench -c 8 -j 4 -T 15 postgres
psql -c "CHECKPOINT;"
wpr -stop pg_kernel.etl
wpa pg_kernel.etl
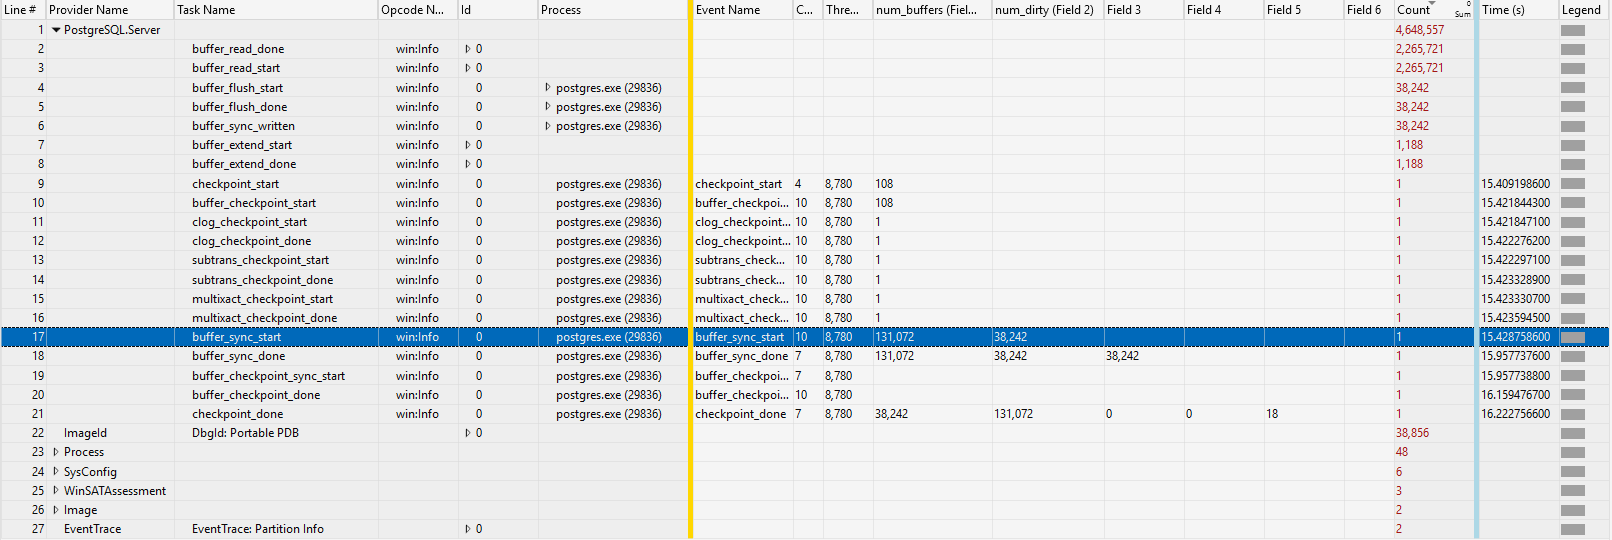
In WPA, drag System Activity > Generic Events and Storage > Disk Usage
into the analysis pane so they share the time axis. The Generic Events table
is already grouped by provider and task. Expand PostgreSQL.Server, find the
checkpoint_start and checkpoint_done rows (widen the Task Name column,
which starts out too narrow to read), and note their Time (s) values.
Right-click a graph, choose Select Time Range, enter those times, then
right-click again and choose Zoom.
To see an event’s fields by name, select its row. The Field 1,
Field 2 column headers change to that event’s field names, such as
num_buffers and num_dirty for buffer_sync_start.
If you only care about Postgres and not the kernel, skip the profile. If your account is in the Performance Log Users group, you can skip the elevated prompt too:
logman create trace pg -p "{ea7811de-e757-5488-7ad6-2b057cced37d}" 0x3 0x4 -bs 64 -o pg.etl -ets
pgbench -S -T 5 postgres
logman stop pg -ets
tracerpt pg.etl -o pg.xml -of XML
0x3 is query plus transaction (0x01 | 0x02), and 0x4 is the INFO
level. Build a different mask from the keyword table for whatever subsystem
you’re after, and use 0x5 instead of 0x4 to include the VERBOSE events.
-bs 64 gives the session 64kB buffers, so an event carrying a long query
isn’t dropped. tracerpt may warn that some events don’t match the schema;
the Postgres events are in pg.xml regardless.
What it costs
If ETW isn’t compiled in (a MinGW or non-Windows build, or one configured with
-Detw=disabled), nothing. The macros are still do {} while (0).
If it is and nobody is tracing, nothing gets written, but each probe still checks whether the provider is enabled. On a read-only benchmark that costs between a fraction of a percent and about two percent of throughput.
Once a session is recording, you pay for what you ask for. With all eight
keywords enabled at INFO, the cost is 13 to 18 percent of throughput, and at
VERBOSE between a quarter and a third. A single low-rate keyword, such as
checkpoint, adds nothing measurable on top of the idle cost. These numbers
come from one machine and one benchmark, so don’t treat them as a spec.
What’s left
The patch is three commits: the backend, one line of CI so the Windows build
exercises it, and the docs. It needs TraceLoggingProvider.h from the Windows SDK, so MSVC builds get
it and MinGW builds keep the dummy probes. On other platforms the server is
unchanged; the build gains the probe cross-check.
The performance testing deserves more than the few numbers above. Measuring a cost this small on Windows took more care than I expected, and that will be its own post.